Numeracy Activation Activity
*Once you finish this Numeracy Activation Activity, don’t forget to move on to the Scientists and Inventors Activation Activity.
(due date: September 29, 2025)
We are consumers and producers. We will be revisiting this theme later in the term. In this activity, you will keep track of how you spend your day.
See the example below of how a person’s day might be spent. Use this example for ideas. You can add your own activities as well.
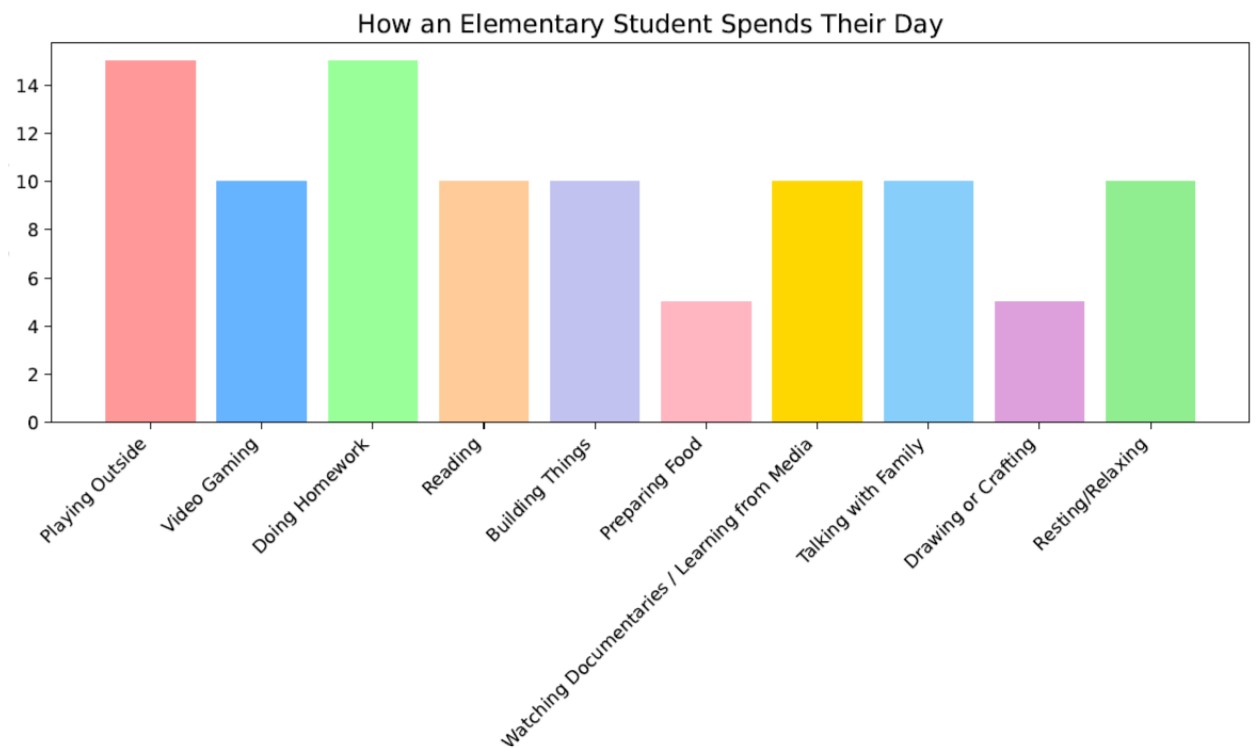
1. Use a chart to keep track of how often YOU engage in various activities:
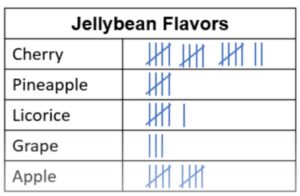
- Students in grades K to 5 will use tally marks to track their personal activity over ONE day (see below for an example of tally marks)
- Students in grades 6 to 8 will use minutes to track their personal activity each day, for THREE days (not necessarily consecutive days)
2. Create a graph to organize the data collected:
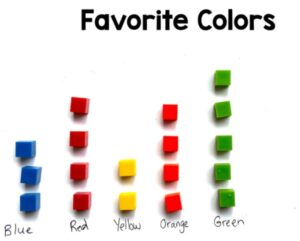
- Students in grades K to 2 will create a concrete graph to show their activities (see below for an example of a concrete graph)
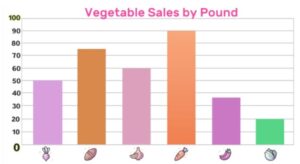
- Students in grade 3 will create a bar graph using one-to-one correspondence (one-to-one correspondence refers to each interval mark on a graph is equal to one count)
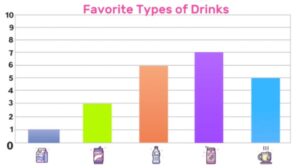
- Students in grades 4 to 5 will create a bar graph using many-to-one correspondence (many-to-one correspondence refers to each interval mark on a graph is equal to specific number of counts such as 2 or 5 or 10)
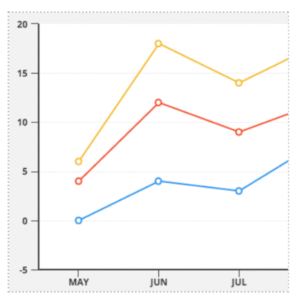
- Students in grade 6 to 8 will create a line graph to show how EACH ACTIVITY LEVEL changes over the three days. (Each line will represent ONE activity; Each line will have 3 data points representing each of the 3 days.)
3. Students in grades 5 to 8 will track the activity of ONE friend/family member over ONE day:
- Students in grade 5 will use tally marks to track their friend/family member’s activity over ONE day
- Students in grades 6 to 8 will use minutes to track their friend/family member’s activity over ONE day
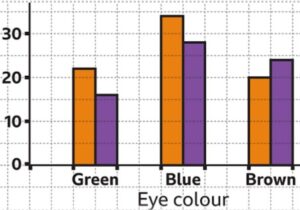
4. Students in grades 5 to 8 will use double bar graphs to compare their personal activity to their FRIEND/FAMILY member’s activity.
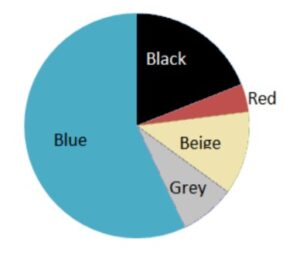
5. Students in grades 7 to 8 will use circle graphs to organize the data collected about their personal activity.
6. Students in grade 8 will analyze central tendencies in the collected data for their personal activity.
Learn more about central tendencies online: https://www.khanacademy.org/math/cc-sixth-grade-math/cc-6th-data-statistics/mean-and-median/v/statistics-intro-mean-median-and-mode